
On this page
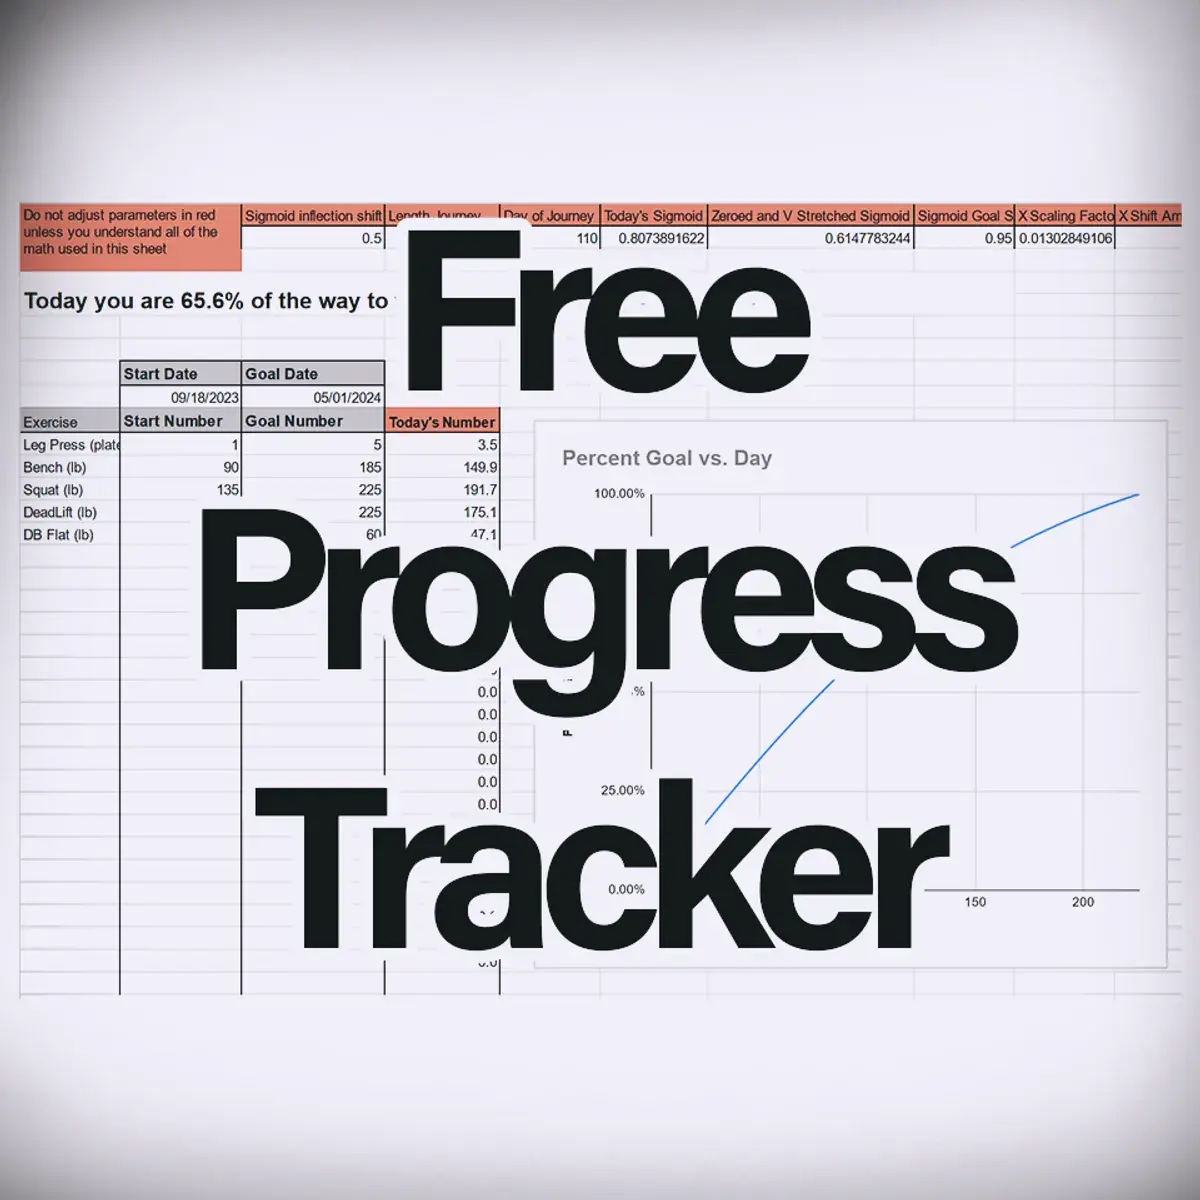
Here is the Recovery Progress Tracking template I made to plan my progress.
You can open it in Google Drive or download it as an Excel file and open it there.
In this post, I will explain how I use this tracker and why. I have a methodology behind it and if it works for you then I am happy to help. It is only a tool and does not make any recommendations on timelines or your own abilities. If you plan to reach unreasonable goals or timelines, you are taking that risk on your own.
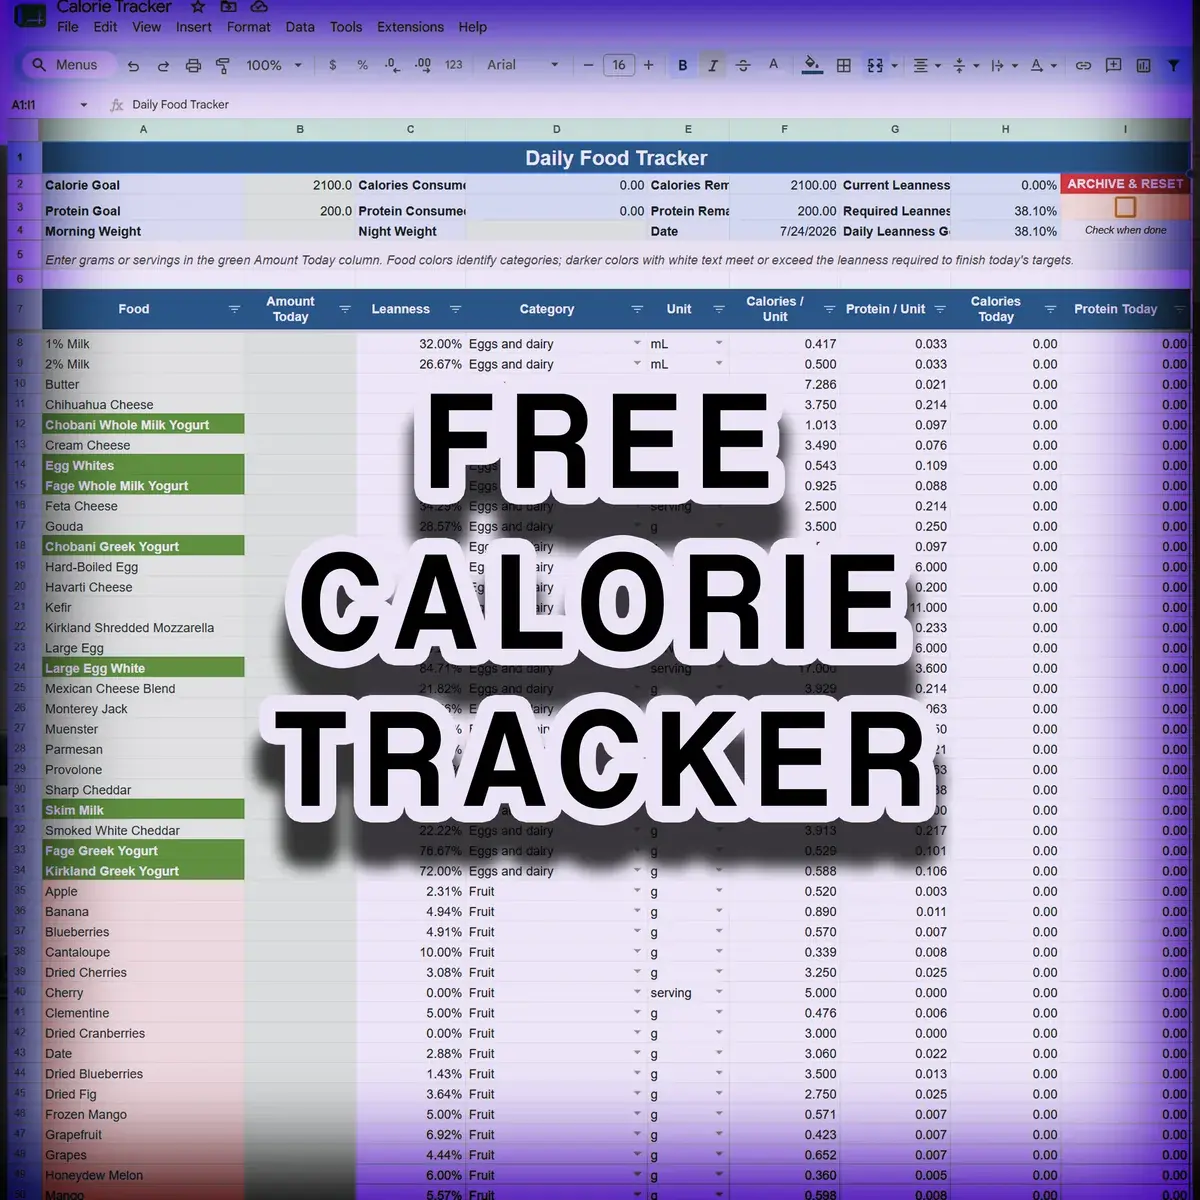
This sheet tracks progress toward one measurable goal. If you need a daily food and bodyweight log instead, use the free calorie, protein, and weight tracking spreadsheet.
Skip to "Using the Progress Tracker" if you only want to know how to use the spreadsheet.
- What is this thing and why do I need it?
- Setting your goals and parameters
- Using it daily
- The Math (If You Care)
What is This Thing and Why Do I Need It?
I made this tracker after shoulder surgery to plan my recovery back to full strength. I had a rough projection of how long recovery should take, but did not know how to gauge my progress along the way. The spreadsheet lets you adjust a few parameters to fit your timeline and goals.
For example, if your goal was to recover your strength back to bench pressing 50lb dumbbells in one hundred days, you were only able to bench press 25 lb dumbbells when you began, and 32 days have already passed of your journey, this sheet would tell you how much weight you should likely be bench pressing on day 32 of your one hundred day journey. Every day you check it, the formulas will automatically update to tell you how far along your progress should be. The 1 Rep Max Calculator can turn a repeatable working set into another strength metric worth tracking.
The way I used this was as a way to slowly ease myself back into lifting more weight after an injury. This way I had a hard ceiling that I was not going to exceed and if anything felt less than good, I just didn't do as much weight. I never exceeded the threshold as a way to keep myself in check. I did not want to progress too fast and reinjure myself. There are many more ways you could use this spreadsheet, but the basic idea is to track your starting point, goal, and length of journey to give you understandable, measurable progress each day. It does not provide any recommendation on how long that journey should be or what a reasonable goal is.
Setting Your Goals and Parameters
On the progress tracker, there are only a few things that you'll need to fill out to start using it. The boxes you need to fill in will be green. You only need to fill in the "Start Date", "End Date", "Start Number", and "Goal Number" to begin using it.
- The "Start Date" is the day you are beginning your journey. You should input the first day from which you are tracking your progress or measuring.
- The "End Date" is the day by which you want to reach your goal. You should input the desired end date.
- The "Start Number" is the number representing your starting point in terms of ability. You can choose to make this any metric you want. For example, if you are trying to regain flexibility and you are measuring how many inches forward you can reach in the sit and reach, then put your current (or starting) ability in inches. Also equally valid, if you are trying to gain strength on a particular lift you should put the amount of weight you are doing on that lift in whatever makes sense (lb, kg, plates, reps, etc.)
- The "Goal Number" should be the final level of ability you are trying to reach on your chosen metric. For example, if you are trying to get to 40 inches on the sit and reach, then put this as 40
- Sigmoid Goal Number (optional) - you can also change this number to affect the curve of the graph. This box is in gray. The closer the number is to 1 the steeper the graph will be. This number must be less than 1 and greater than 0.5
The sheet includes some examples. Once you fill in the green boxes, the red boxes automatically fill in your guidelines.
The "By Percent" sheet lets you enter a percentage instead of a "Start Number" for the weight you can lift today. If you think you are at 50% of your old strength, enter 50% as your starting point. It then calculates your weights from your end goal and time frame in the same way.
Using it Daily
Now that you have set up your parameters, to use this sheet, simply check it every day before you go to train. It will automatically tell you what your value is for today along with a graph to visualize your progress on your journey. For example, if you are trying to reach a certain number of plates on the leg press machine, it will tell you how many plates you should be doing today if you are going to reach your goal on time. You do not need to re-input any parameters or dates. It will automatically update the numbers based on it being a new day. Also, note that the graph represents the percentage of the way you are toward your goal using your starting point as the 0% point.
Remember, though, it does not do anything to help you pick reasonable goals, it only creates an easy path to follow. Do not be afraid to adjust your goals and timelines as you need. If your goal is gaining or losing bodyweight, use the Bodyweight Planner to set a more realistic rate before you enter the dates.
The Math (If You Care)
The thought behind this was that I did not think progress should be directly linear from start to end. So, I decided to just take a function that asymptotes at 1 and crosses the y-axis between 0 and 1 as a good starting point. For this, I chose the sigmoid function, commonly used in machine learning algorithms. The sigmoid function is described here. Then It was just a matter of stretching the function to fit the purpose in mind.
Now because the function asymptotes at 1, I chose an arbitrary value which I call "Sigmoid Goal Stretch" in the sheet to be our effective 1. The default I chose was 0.95, but this can be changed if you desire. I adjust the length of time to reach this value by finding the distance between our start and end dates and just ensuring that our function crosses our "Sigmoid Goal Stretch" at the end of that time. This stretching factor applied to the basic sigmoid function's x is the value in the "X Scaling Factor" box. That means if you adjust this value to be closer to 1 then it will have a harsher curve in the beginning, and if you bring it close to 0.5 it will be almost completely linear. You should not change it to be over 1 or below 0.5. Generally keeping it between 0.9 and 1 will be best because of the other automatic scaling I have built in.
Simultaneously, I ensure our y-intercept is stretched to hit the y-axis at the point from which we start our journey by subtracting the "Sigmoid Inflection Shift" and multiplying the function by a scaling factor of (1/(1-" Sigmoid Inflection Shift")). This stretches our journey to start at 0% even if we shift the function left or right for some reason.
Finally, I just make some adjustments to ensure that we actually end up smoothly reaching 1 to represent 100% completion by the end of the journey. To do this I just use the "Daily Adjustment'' Column to calculate how far in our journey we are and then linearly adjust upward to make sure it crosses 1 at our "Sigmoid Goal Stretch" value. Since it is just a straight linear adjustment based on the percent completion of the journey, changing the sigmoid goal stretch outside of the 0.9 to 1 range can result in some not-so-useful graphs.
For generating what number we are doing today in terms of your actual workouts, I just take how far along the adjusted sigmoid curve we are, which is now representing our percentage completion of the journey, and use that to add the percent difference of our starting number to our goal number. This way we add 100% of the difference between these two numbers at the end of the journey, 0% at the beginning, and the percentage represented on the curve for that day.
Adjust the parameters in red at your own peril if you understand the equations or just want to mess with them. Otherwise, it is just some math I did to make this thing spit out what numbers you should be doing on the day you look at this thing.